
A/B Testing with Graphic Design - Optimizing Your Graphics for Better Results
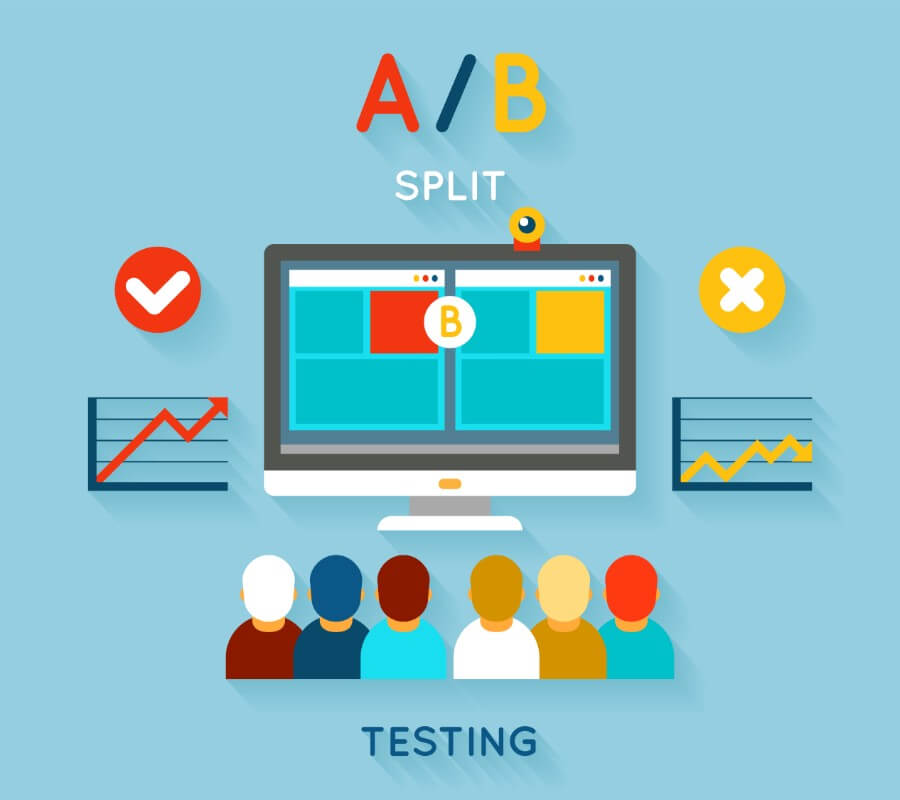
In the fast-paced digital marketing arena, the role of graphic design is undeniably crucial in capturing the attention of audiences and effectively conveying messages. The aesthetic appeal of designs, however, isn’t the only factor determining their success. The true impact of graphics is measured by their ability to resonate with the target audience and drive desired outcomes, a process meticulously refined through A/B testing. A/B testing, or split testing, is a scientific method of comparing two versions of a webpage, advertisement, or email to determine which one performs better in achieving predefined objectives. This comprehensive exploration into A/B testing for graphic design offers insights into optimizing your graphics for superior results.
Define the outcome and comparison before running the test
An A/B test compares alternatives under a defined measurement approach. A difference between two posts published at different times is not automatically evidence that the graphic caused the result.
Write down the intended action, eligible audience, variants, measurement period and decision rule before looking at outcomes. Keep the offer and destination consistent when the design is the variable of interest.
| Record | Why it matters |
|---|---|
| Variant | Identifies the actual change being evaluated |
| Exposure | Gives a denominator for interpreting response |
| Target action | Keeps reactions distinct from the desired result |
| Context | Records timing, placement and other interventions |
For an illustrative comparison, contrast a product close-up with a product-in-use image using the same approved offer. Report the observed actions alongside exposure and uncertainty. Avoid selecting a result only because a small early difference looks attractive.
The anonymous percentage examples below supply no underlying study. They cannot establish that a particular button colour or hero image will improve another campaign.
Use the CTA promise review, the banner campaign brief and the page experience review to keep the comparison connected to a useful journey.
Practical guidance revised November 1, 2026. Examples are illustrative.
Understanding A/B Testing in Graphic Design
A/B testing in the realm of graphic design is a comparative analysis between two design variants, A and B, which are identical except for one differing element that could influence a user’s behavior. This single variable could range from color schemes, layout formats, image choices, to font styles and sizes. The primary aim is to identify which variant garners a superior conversion rate or enhanced engagement metrics, thereby guiding design decisions with empirical evidence rather than speculative guesses.
Why A/B Test Your Graphics?
In an era where digital content saturation is at its peak, standing out becomes a formidable challenge. A/B testing empowers designers and marketers to make informed decisions rooted in data, rather than subjective preferences. Understanding what truly appeals to your audience enables the creation of more compelling and action-driven designs. Whether the goal is to amplify purchase rates, escalate newsletter subscriptions, or engage users more deeply, A/B testing provides the roadmap to achieving these objectives with precision and confidence.
How to Conduct A/B Testing
Define Your Objective: Start with a clear, measurable goal. What is the test intended to improve? This could be increasing the click-through rate on a specific call-to-action, enhancing email open rates, or lifting overall sales conversions.
Select the Element to Test: Choose a single design element for the test. This might be the phrasing of a headline, the positioning of a call-to-action button, or the imagery used on a landing page. The key is to isolate one variable that you hypothesize will influence user behavior.
Create Your Variants: Develop two versions of your design: the control version (A) and the experimental version (B). Ensure that the only difference between them is the variable you’re testing to accurately measure its impact.
Split Your Audience: Divide your audience into two groups, ensuring they are as similar as possible to each other to prevent external factors from skewing the results.
Run the Test: Utilize A/B testing tools such as Google Optimize, Optimizely, or VWO to serve the different versions to your audience segments. These tools can automate the distribution and collect comprehensive performance data.
Analyze the Results: After collecting sufficient data, analyze the performance of each version. Look for statistically significant differences that indicate which version better achieves your defined objective.
Implement and Repeat: Adopt the more successful version as your new standard. However, A/B testing is an iterative process. Continuous testing on other elements can lead to ongoing improvements and optimizations.
Best Practices for A/B Testing in Graphic Design
Test One Element at a Time: To accurately attribute performance differences to the variable being tested, modify only one element at a time. This simplifies analysis and provides clear insights into what changes impact user behavior.
Ensure Statistical Significance: Patience is key in A/B testing. Collect enough data to ensure that your results are statistically reliable, avoiding premature conclusions that could lead to false assumptions.
Consider the Entire User Journey: It’s vital to understand how the tested element fits into the larger context of the user’s experience. A change that improves one metric but harms another is counterproductive. Strive for improvements that enhance the overall conversion funnel.
Keep Testing: Preferences and behaviors evolve, so what’s effective today may not be tomorrow. Adopt a culture of continuous testing and learning to keep your designs fresh and engaging.
Tools for A/B Testing Graphic Design
- Google Optimize: Offers seamless integration with Google Analytics, providing a straightforward setup for A/B tests and insightful performance analysis.
- Optimizely: Features advanced A/B testing capabilities along with personalization options to craft unique user experiences.
- VWO (Visual Website Optimizer): A comprehensive suite of optimization tools, including A/B testing, heatmaps, and visitor behavior analytics, to refine user interactions.
Case Studies: Success Stories of A/B Testing
Illustrating the power of A/B testing, numerous brands have harnessed this approach to significantly enhance their design strategies:
- An illustrative retailer test could compare two hero images; no source or dataset is supplied to substantiate the original 35% conversion claim.
- A button-colour comparison is a possible test, but the article supplies no attributable study supporting its original 21% click-through claim.
These instances underscore the transformative potential of A/B testing in guiding data-backed design decisions that markedly influence business metrics.
Conclusion
A/B testing is an indispensable strategy in the graphic design toolkit, enabling the optimization of visual elements to meet and exceed business objectives. Through systematic testing and analysis, designers can unearth valuable insights into audience preferences, crafting designs that not only captivate but also convert. Embracing a cycle of continuous testing, learning, and optimizing is essential for evolving designs that are both aesthetically pleasing and functionally effective. In the competitive digital landscape, optimizing graphics through A/B testing is more than a best practice—it’s a vital component for achieving relevance, differentiation, and success.